本記事では、カスタマイズ可能な円(ドーナツ)グラフ・棒グラフ・レーダーチャートデザインのコードをご紹介します。
HTMLとCSSの両方をコピペすればすぐに利用できます。
コピペしたコードをカスタマイズし、自分好みにぜひ変更してみてください。
また、グラフ作成にはdivタグの要素に対してCSSデザインを施します。
divタグの使い方を詳しく知りたい人は「【HTML】divタグの使い方:横並びや中央寄せ・CSS装飾」を一読ください。
おしゃれなフリー素材デザイン集
本サイトでは、円(ドーナツ)グラフ・棒グラフ・レーダーチャート以外にも様々なHTML&CSSによるおしゃれな素材をご用意しています。
以下は、主なデザインカテゴリーです。
ぜひTOPページから「デザインギャラリー」を一読頂けますと幸いです。
シンプルな円グラフ(pie-chart)
ここでは、以下のシンプルな円グラフデザイン例を記載しています。
- スタンダード
- 項目×2
実際のデザインプレビューとHTML&CSSコードを記載しています。
さらに、以下の項目も円グラフページでは選択式でご用意しました。
- グラフの色
- 背景色
- 割合の表示:あり, なし
- 割合(パーセンテージ)
ご興味があれば「円グラフ一覧ページ」を一読ください。
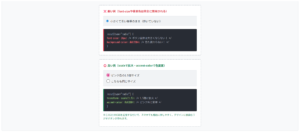
スタンダード
HTMLコード表示
<div class="pie-chart-1">
  <span>60%</span>
</div>
CSSコード表示
.pie-chart-1 {
  position: relative;
  width: 200px;
  height: 200px;
  margin: 0 auto 2em;
  border-radius: 50%;
  background-image: conic-gradient(#2589d0 60%, #f2f2f2 60% 100%);
}

.pie-chart-1 span {
  position: absolute;
  top: 50%;
  right: 25%;
  transform: translate(50%, -50%);
  color: #fff;
  font-weight: 600;
  font-size: 1.1em;
}
項目×2
- 項目170%
- 項目220%
HTMLコード表示
<div class="pie-chart-2">
  <div></div>
  <ol>
    <li><span>項目1</span>70%</li>
    <li><span>項目2</span>20%</li>
  </ol>
</div>
CSSコード表示
.pie-chart-2 {
  display: flex;
  justify-content: center;
  align-items: center;
}

.pie-chart-2 > div {
  width: 200px;
  height: 200px;
  margin: 0;
  border-radius: 50%;
  background-image: conic-gradient(#2589d0 70%, #5ba9f7 70% 90%, #f2f2f2 90% 100%);
}

.pie-chart-2 li {
  display: flex;
  list-style-type: none;
  align-items: center;
  font-size: .8em;
}

.pie-chart-2 li::before {
  display: inline-block;
  width: 1.2em;
  height: .8em;
  margin-right: 5px;
  content: '';
}

.pie-chart-2 li:nth-child(1)::before {
  background-color: #2589d0;
}

.pie-chart-2 li:nth-child(2)::before {
  background-color: #5ba9f7;
}

.pie-chart-2 span {
  margin-right: 10px;
  font-weight: 600;
}
ドーナツ型の円グラフ(pie-chart)
ここでは、以下のドーナツ型の円グラフデザイン例を記載しています。
- スタンダード
実際のデザインプレビューとHTML&CSSコードを記載しています。
さらに、以下の項目も円グラフページでは選択式でご用意しました。
- グラフの色
- 背景色
- 割合の表示:あり, なし
- 割合(パーセンテージ)
ご興味があれば「円グラフ一覧ページ」を一読ください。
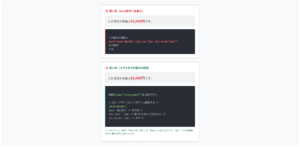
スタンダード
HTMLコード表示
<div class="pie-chart-3">
  円グラフの例
</div>
CSSコード表示
.pie-chart-3 {
  display: flex;
  justify-content: center;
  align-items: center;
  width: 200px;
  height: 200px;
  margin: 0 auto 2em;
  border-radius: 50%;
  background-image: radial-gradient(#fff 55%, transparent 55%), conic-gradient(#2589d0 60%, #f2f2f2 60% 100%);
  font-weight: 600;
}
横方向の棒グラフ(bar-chart)
ここでは、以下の横方向の棒グラフデザイン例を記載しています。
- スタンダード
- 背景色あり
実際のデザインプレビューとHTML&CSSコードを記載しています。
さらに、以下の項目も棒グラフページでは選択式でご用意しました。
- バーの色
- アニメーション:あり, なし
- 項目1:パーセンテージ
- 項目2:パーセンテージ
- 項目3:パーセンテージ
ご興味があれば「棒グラフ一覧ページ」を一読ください。
スタンダード
HTMLコード表示
<dl class="bar-chart-1">
  <div>
    <dt>項目1</dt>
    <dd style="width: 60%">60%</dd>
  </div>
  <div>
    <dt>項目2</dt>
    <dd style="width: 70%">70%</dd>
  </div>
  <div>
    <dt>項目3</dt>
    <dd style="width: 80%">80%</dd>
  </div>
</dl>
CSSコード表示
.bar-chart-1 {
font-size: .9em;
}
.bar-chart-1 > div {
display: flex;
align-items: center;
margin-bottom: 7px;
}
.bar-chart-1 dt {
width: 55px;
min-width: 55px;
}
.bar-chart-1 dd {
margin: 0;
padding-right: 15px;
border-radius: 3px;
background-color: #2589d0;
color: #fff;
font-weight: 600;
line-height: 45px;
text-align: right;
white-space: nowrap;
animation: anim-bar-chart-1 1s ease-out;
}
@keyframes anim-bar-chart-1 {
0% {
width: 0;
}
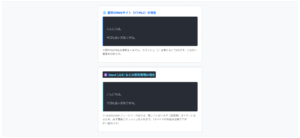
}背景色あり
HTMLコード表示
<dl class="bar-chart-2">
  <div>
    <dt>項目1</dt>
    <dd><span style="width: 60%">60%</span></dd>
  </div>
  <div>
    <dt>項目2</dt>
    <dd><span style="width: 70%">70%</span></dd>
  </div>
  <div>
    <dt>項目3</dt>
    <dd><span style="width: 80%">80%</span></dd>
  </div>
</dl>
CSSコード表示
.bar-chart-2 {
font-size: .9em;
}
.bar-chart-2 > div {
display: flex;
align-items: center;
margin-bottom: 7px;
}
.bar-chart-2 dt {
width: 55px;
min-width: 55px;
}
.bar-chart-2 dd {
width: 100%;
margin: 0;
border-radius: 3px;
background-color: #f2f2f2;
}
.bar-chart-2 span {
display: inline-block;
padding-right: 15px;
border-radius: inherit;
background-color: #2589d0;
color: #fff;
font-weight: 600;
line-height: 45px;
text-align: right;
white-space: nowrap;
animation: anim-bar-chart-2 1s ease-out;
}
@keyframes anim-bar-chart-2 {
0% {
width: 0;
}
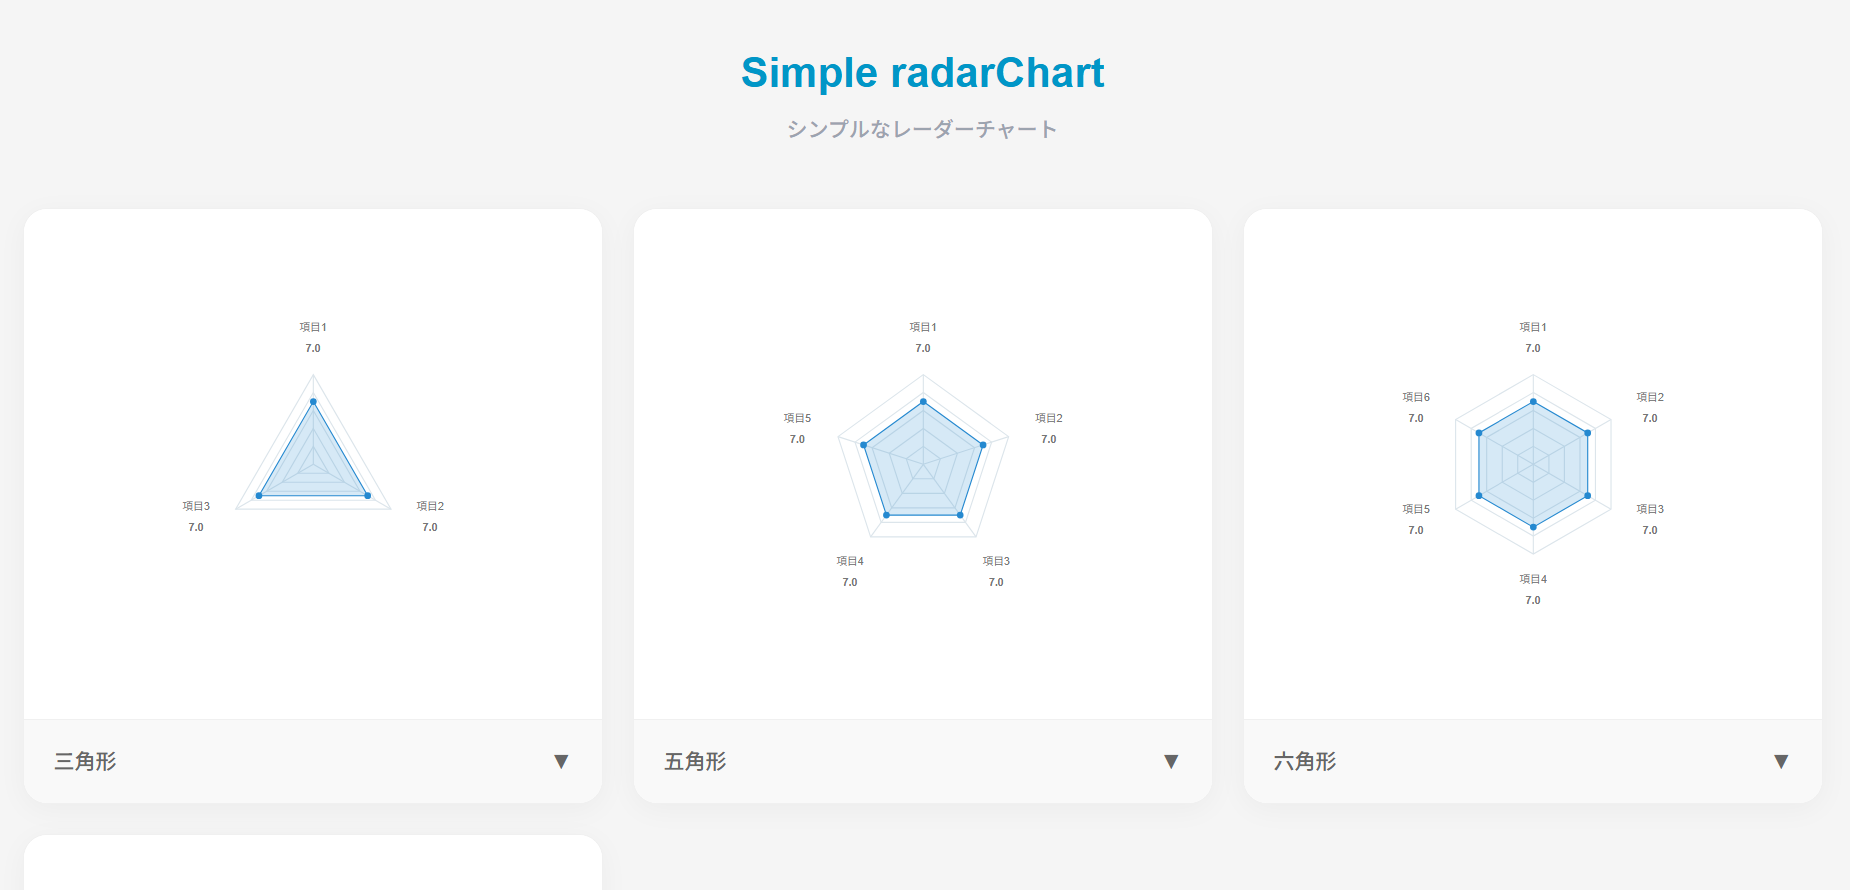
}シンプルなレーダーチャート(radar-chart)
ここでは、以下のシンプルなレーダーチャートデザイン例を記載しています。
- 三角形
- 五角形
- 六角形
- 七角形
実際のデザインプレビューとHTML&CSSコードを記載しています。
さらに、以下の項目もレーダーチャートページでは選択式でご用意しました。
- 基調色
- 項目1~7の値
ご興味があれば「レーダーチャート一覧ページ」を一読ください。
三角形
- 項目1
- 7.0
- 項目2
- 7.0
- 項目3
- 7.0
HTMLコード表示
<div class="radar-chart-1">
<svg xmlns="http://www.w3.org/2000/svg" viewBox="0 0 200 200">
  <g stroke="#dce5eb">
<path d="M 100 100 L 100.0 20.0"/>
<path d="M 100 100 L 169.3 140.0"/>
<path d="M 100 100 L 30.7 140.0"/>
</g>
<g stroke="#dce5eb" fill="none">
<path d="M 100.0 84.0 L 113.9 108.0 L 86.1 108.0 Z"/>
<path d="M 100.0 68.0 L 127.7 116.0 L 72.3 116.0 Z"/>
<path d="M 100.0 52.0 L 141.6 124.0 L 58.4 124.0 Z"/>
<path d="M 100.0 36.0 L 155.4 132.0 L 44.6 132.0 Z"/>
<path d="M 100.0 20.0 L 169.3 140.0 L 30.7 140.0 Z"/>
</g>

  <path d="M 100.0 44.0 L 148.5 128.0 L 51.5 128.0 Z" fill="#2589d030" stroke="#2589d0"/>
  <g fill="#2589d0">
    <circle cx="100.0" cy="44.0" r="3"/>
<circle cx="148.5" cy="128.0" r="3"/>
<circle cx="51.5" cy="128.0" r="3"/>
  </g>
</svg>
<dl>

  <div>
    <dt>項目1</dt>
    <dd>7.0</dd>
  </div>
  <div>
    <dt>項目2</dt>
    <dd>7.0</dd>
  </div>
  <div>
    <dt>項目3</dt>
    <dd>7.0</dd>
  </div>
</dl>
</div>
CSSコード表示
.radar-chart-1 {
display: flex;
justify-content: center;
align-items: center;
position: relative;
width: 230px;
height: 230px;
margin: 0 auto;
padding: 35px;
box-sizing: content-box;
}
.radar-chart-1 svg {
width: 100%;
height: 100%;
}
.radar-chart-1 dl {
position: absolute;
width: 100%;
height: 100%;
margin: 0;
padding: 0;
}
.radar-chart-1 dl > div {
position: absolute;
color: #777;
font-size: .6em;
text-align: center;
}
.radar-chart-1 dl > div:nth-child(1) {
top: 0;
left: 50%;
transform: translateX(-50%);
}
.radar-chart-1 dl > div:nth-child(2) {
bottom: 25%;
right: 10%;
transform: translateX(50%);
}
.radar-chart-1 dl > div:nth-child(3) {
bottom: 25%;
left: 10%;
transform: translateX(-50%);
}
.radar-chart-1 dt {
margin: 0;
font-weight: normal;
}
.radar-chart-1 dd {
margin: 0;
font-weight: bold;
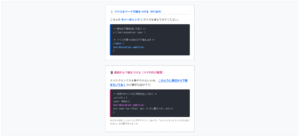
}五角形
- 項目1
- 7.0
- 項目2
- 7.0
- 項目3
- 7.0
- 項目4
- 7.0
- 項目5
- 7.0
HTMLコード表示
<div class="radar-chart-2">
<svg xmlns="http://www.w3.org/2000/svg" viewBox="0 0 200 200">
  <g stroke="#dce5eb">
<path d="M 100 100 L 100.0 20.0"/>
<path d="M 100 100 L 176.1 75.3"/>
<path d="M 100 100 L 147.0 164.7"/>
<path d="M 100 100 L 53.0 164.7"/>
<path d="M 100 100 L 23.9 75.3"/>
</g>
<g stroke="#dce5eb" fill="none">
<path d="M 100.0 84.0 L 115.2 95.1 L 109.4 112.9 L 90.6 112.9 L 84.8 95.1 Z"/>
<path d="M 100.0 68.0 L 130.4 90.1 L 118.8 125.9 L 81.2 125.9 L 69.6 90.1 Z"/>
<path d="M 100.0 52.0 L 145.7 85.2 L 128.2 138.8 L 71.8 138.8 L 54.3 85.2 Z"/>
<path d="M 100.0 36.0 L 160.9 80.2 L 137.6 151.8 L 62.4 151.8 L 39.1 80.2 Z"/>
<path d="M 100.0 20.0 L 176.1 75.3 L 147.0 164.7 L 53.0 164.7 L 23.9 75.3 Z"/>
</g>

  <path d="M 100.0 44.0 L 153.3 82.7 L 132.9 145.3 L 67.1 145.3 L 46.7 82.7 Z" fill="#2589d030" stroke="#2589d0"/>
  <g fill="#2589d0">
    <circle cx="100.0" cy="44.0" r="3"/>
<circle cx="153.3" cy="82.7" r="3"/>
<circle cx="132.9" cy="145.3" r="3"/>
<circle cx="67.1" cy="145.3" r="3"/>
<circle cx="46.7" cy="82.7" r="3"/>
  </g>
</svg>
<dl>

  <div>
    <dt>項目1</dt>
    <dd>7.0</dd>
  </div>
  <div>
    <dt>項目2</dt>
    <dd>7.0</dd>
  </div>
  <div>
    <dt>項目3</dt>
    <dd>7.0</dd>
  </div>
  <div>
    <dt>項目4</dt>
    <dd>7.0</dd>
  </div>
  <div>
    <dt>項目5</dt>
    <dd>7.0</dd>
  </div>
</dl>
</div>
CSSコード表示
.radar-chart-2 {
  display: flex;
  justify-content: center;
  align-items: center;
  position: relative;
  width: 230px;
  height: 230px;
  margin: 0 auto;
  padding: 35px;
  box-sizing: content-box;
}

.radar-chart-2 svg {
  width: 100%;
  height: 100%;
}

.radar-chart-2 dl {
  position: absolute;
  width: 100%;
  height: 100%;
  margin: 0;
  padding: 0;
}

.radar-chart-2 dl > div {
  position: absolute;
  color: #777;
  font-size: .6em;
  text-align: center;
}

.radar-chart-2 dl > div:nth-child(1) {
  top: 0;
  left: 50%;
  transform: translateX(-50%);
}

.radar-chart-2 dl > div:nth-child(2) {
  top: 31%;
  right: 7%;
  transform: translateX(50%);
}

.radar-chart-2 dl > div:nth-child(3) {
  bottom: 6%;
  right: 25%;
  transform: translateX(50%);
}

.radar-chart-2 dl > div:nth-child(4) {
  bottom: 6%;
  left: 25%;
  transform: translateX(-50%);
}

.radar-chart-2 dl > div:nth-child(5) {
  top: 31%;
  left: 7%;
  transform: translateX(-50%);
}

.radar-chart-2 dt {
  margin: 0;
  font-weight: normal;
}

.radar-chart-2 dd {
  margin: 0;
  font-weight: bold;
}
六角形
- 項目1
- 7.0
- 項目2
- 7.0
- 項目3
- 7.0
- 項目4
- 7.0
- 項目5
- 7.0
- 項目6
- 7.0
HTMLコード表示
<div class="radar-chart-3">
<svg xmlns="http://www.w3.org/2000/svg" viewBox="0 0 200 200">
  <g stroke="#dce5eb">
<path d="M 100 100 L 100.0 20.0"/>
<path d="M 100 100 L 169.3 60.0"/>
<path d="M 100 100 L 169.3 140.0"/>
<path d="M 100 100 L 100.0 180.0"/>
<path d="M 100 100 L 30.7 140.0"/>
<path d="M 100 100 L 30.7 60.0"/>
</g>
<g stroke="#dce5eb" fill="none">
<path d="M 100.0 84.0 L 113.9 92.0 L 113.9 108.0 L 100.0 116.0 L 86.1 108.0 L 86.1 92.0 Z"/>
<path d="M 100.0 68.0 L 127.7 84.0 L 127.7 116.0 L 100.0 132.0 L 72.3 116.0 L 72.3 84.0 Z"/>
<path d="M 100.0 52.0 L 141.6 76.0 L 141.6 124.0 L 100.0 148.0 L 58.4 124.0 L 58.4 76.0 Z"/>
<path d="M 100.0 36.0 L 155.4 68.0 L 155.4 132.0 L 100.0 164.0 L 44.6 132.0 L 44.6 68.0 Z"/>
<path d="M 100.0 20.0 L 169.3 60.0 L 169.3 140.0 L 100.0 180.0 L 30.7 140.0 L 30.7 60.0 Z"/>
</g>

  <path d="M 100.0 44.0 L 148.5 72.0 L 148.5 128.0 L 100.0 156.0 L 51.5 128.0 L 51.5 72.0 Z" fill="#2589d030" stroke="#2589d0"/>
  <g fill="#2589d0">
    <circle cx="100.0" cy="44.0" r="3"/>
<circle cx="148.5" cy="72.0" r="3"/>
<circle cx="148.5" cy="128.0" r="3"/>
<circle cx="100.0" cy="156.0" r="3"/>
<circle cx="51.5" cy="128.0" r="3"/>
<circle cx="51.5" cy="72.0" r="3"/>
  </g>
</svg>
<dl>

  <div>
    <dt>項目1</dt>
    <dd>7.0</dd>
  </div>
  <div>
    <dt>項目2</dt>
    <dd>7.0</dd>
  </div>
  <div>
    <dt>項目3</dt>
    <dd>7.0</dd>
  </div>
  <div>
    <dt>項目4</dt>
    <dd>7.0</dd>
  </div>
  <div>
    <dt>項目5</dt>
    <dd>7.0</dd>
  </div>
  <div>
    <dt>項目6</dt>
    <dd>7.0</dd>
  </div>
</dl>
</div>
CSSコード表示
.radar-chart-3 {
  display: flex;
  justify-content: center;
  align-items: center;
  position: relative;
  width: 230px;
  height: 230px;
  margin: 0 auto;
  padding: 35px;
  box-sizing: content-box;
}

.radar-chart-3 svg {
  width: 100%;
  height: 100%;
}

.radar-chart-3 dl {
  position: absolute;
  width: 100%;
  height: 100%;
  margin: 0;
  padding: 0;
}

.radar-chart-3 dl > div {
  position: absolute;
  color: #777;
  font-size: .6em;
  text-align: center;
}

.radar-chart-3 dl > div:nth-child(1) {
  top: 0;
  left: 50%;
  transform: translateX(-50%);
}

.radar-chart-3 dl > div:nth-child(2) {
  top: 24%;
  right: 10%;
  transform: translateX(50%);
}

.radar-chart-3 dl > div:nth-child(3) {
  bottom: 24%;
  right: 10%;
  transform: translateX(50%);
}

.radar-chart-3 dl > div:nth-child(4) {
  bottom: 0;
  left: 50%;
  transform: translateX(-50%);
}

.radar-chart-3 dl > div:nth-child(5) {
  bottom: 24%;
  left: 10%;
  transform: translateX(-50%);
}

.radar-chart-3 dl > div:nth-child(6) {
  top: 24%;
  left: 10%;
  transform: translateX(-50%);
}

.radar-chart-3 dt {
  margin: 0;
  font-weight: normal;
}

.radar-chart-3 dd {
  margin: 0;
  font-weight: bold;
}
七角形
- 項目1
- 7.0
- 項目2
- 7.0
- 項目3
- 7.0
- 項目4
- 7.0
- 項目5
- 7.0
- 項目6
- 7.0
- 項目7
- 7.0
HTMLコード表示
<div class="radar-chart-4">
<svg xmlns="http://www.w3.org/2000/svg" viewBox="0 0 200 200">
  <g stroke="#dce5eb">
<path d="M 100 100 L 100.0 20.0"/>
<path d="M 100 100 L 162.5 50.1"/>
<path d="M 100 100 L 178.0 117.8"/>
<path d="M 100 100 L 134.7 172.1"/>
<path d="M 100 100 L 65.3 172.1"/>
<path d="M 100 100 L 22.0 117.8"/>
<path d="M 100 100 L 37.5 50.1"/>
</g>
<g stroke="#dce5eb" fill="none">
<path d="M 100.0 84.0 L 112.5 90.0 L 115.6 103.6 L 106.9 114.4 L 93.1 114.4 L 84.4 103.6 L 87.5 90.0 Z"/>
<path d="M 100.0 68.0 L 125.0 80.0 L 131.2 107.1 L 113.9 128.8 L 86.1 128.8 L 68.8 107.1 L 75.0 80.0 Z"/>
<path d="M 100.0 52.0 L 137.5 70.1 L 146.8 110.7 L 120.8 143.2 L 79.2 143.2 L 53.2 110.7 L 62.5 70.1 Z"/>
<path d="M 100.0 36.0 L 150.0 60.1 L 162.4 114.2 L 127.8 157.7 L 72.2 157.7 L 37.6 114.2 L 50.0 60.1 Z"/>
<path d="M 100.0 20.0 L 162.5 50.1 L 178.0 117.8 L 134.7 172.1 L 65.3 172.1 L 22.0 117.8 L 37.5 50.1 Z"/>
</g>

  <path d="M 100.0 44.0 L 143.8 65.1 L 154.6 112.5 L 124.3 150.5 L 75.7 150.5 L 45.4 112.5 L 56.2 65.1 Z" fill="#2589d030" stroke="#2589d0"/>
  <g fill="#2589d0">
    <circle cx="100.0" cy="44.0" r="3"/>
<circle cx="143.8" cy="65.1" r="3"/>
<circle cx="154.6" cy="112.5" r="3"/>
<circle cx="124.3" cy="150.5" r="3"/>
<circle cx="75.7" cy="150.5" r="3"/>
<circle cx="45.4" cy="112.5" r="3"/>
<circle cx="56.2" cy="65.1" r="3"/>
  </g>
</svg>
<dl>

  <div>
    <dt>項目1</dt>
    <dd>7.0</dd>
  </div>
  <div>
    <dt>項目2</dt>
    <dd>7.0</dd>
  </div>
  <div>
    <dt>項目3</dt>
    <dd>7.0</dd>
  </div>
  <div>
    <dt>項目4</dt>
    <dd>7.0</dd>
  </div>
  <div>
    <dt>項目5</dt>
    <dd>7.0</dd>
  </div>
  <div>
    <dt>項目6</dt>
    <dd>7.0</dd>
  </div>
  <div>
    <dt>項目7</dt>
    <dd>7.0</dd>
  </div>
</dl>
</div>
CSSコード表示
.radar-chart-4 {
  display: flex;
  justify-content: center;
  align-items: center;
  position: relative;
  width: 230px;
  height: 230px;
  margin: 0 auto;
  padding: 35px;
  box-sizing: content-box;
}

.radar-chart-4 svg {
  width: 100%;
  height: 100%;
}

.radar-chart-4 dl {
  position: absolute;
  width: 100%;
  height: 100%;
  margin: 0;
  padding: 0;
}

.radar-chart-4 dl > div {
  position: absolute;
  color: #777;
  font-size: .6em;
  text-align: center;
}

.radar-chart-4 dl > div:nth-child(1) {
  top: 0;
  left: 50%;
  transform: translateX(-50%);
}

.radar-chart-4 dl > div:nth-child(2) {
  top: 18%;
  right: 14%;
  transform: translateX(50%);
}

.radar-chart-4 dl > div:nth-child(3) {
  bottom: 36%;
  right: 6%;
  transform: translateX(50%);
}

.radar-chart-4 dl > div:nth-child(4) {
  bottom: 3%;
  right: 32%;
  transform: translateX(50%);
}

.radar-chart-4 dl > div:nth-child(5) {
  bottom: 3%;
  left: 32%;
  transform: translateX(-50%);
}

.radar-chart-4 dl > div:nth-child(6) {
  bottom: 36%;
  left: 6%;
  transform: translateX(-50%);
}

.radar-chart-4 dl > div:nth-child(7) {
  top: 18%;
  left: 14%;
  transform: translateX(-50%);
}

.radar-chart-4 dt {
  margin: 0;
  font-weight: normal;
}

.radar-chart-4 dd {
  margin: 0;
  font-weight: bold;
}